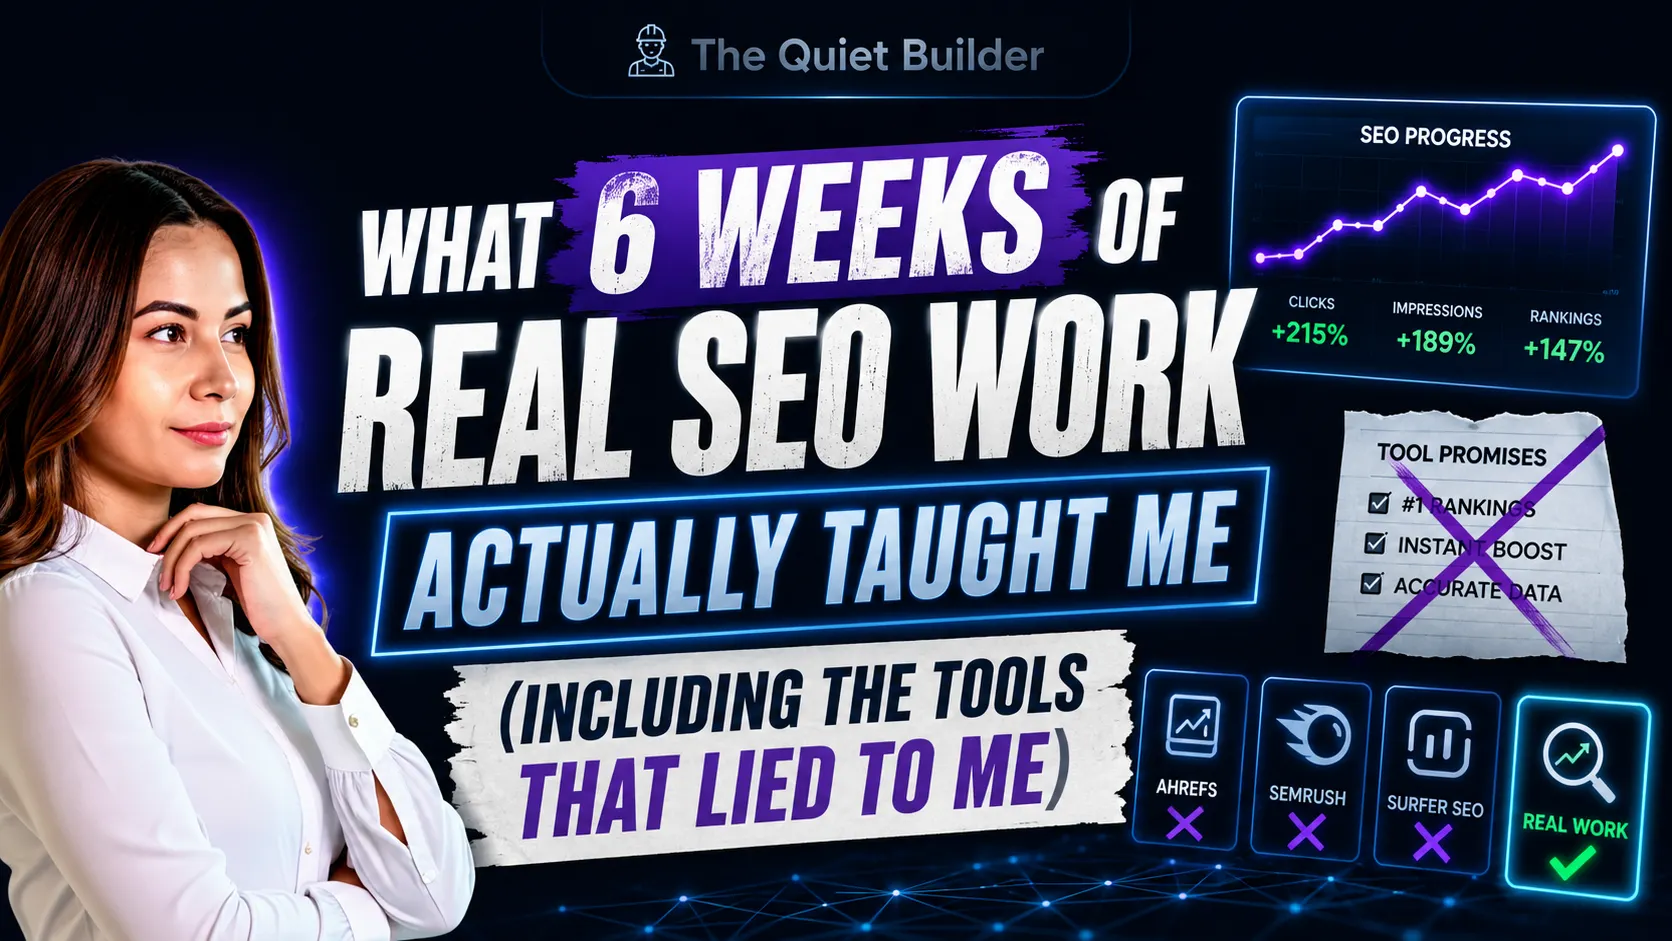
What 6 Weeks of Real SEO Work Actually taught Me, Including the Tools that Lied to Me
What 6 Weeks of Real SEO Work Actually taught Me, Including the Tools that Lied to Me
Jul 19, 2026
I started this blog in mid-May. I didn't touch SEO seriously until June. Somewhere in between, I took a week off to travel. So when I say I've been "doing SEO" — what I actually mean is: six weeks, give or take, of real, hands-on, occasionally humbling work.
I want to write this down honestly, not as a highlight reel. Partly because I've been looking for SEO-adjacent projects lately and kept getting asked the same question in different forms — "walk me through your SEO experience" — and I realized the truest answer wasn't a case study I'd polished. It was this three tools, one canonical conflict, a missing sitemap, and a lot of learning to trust data over dashboards.
The Starting Point
srimarketer.com already had basic on-page SEO set up inside GroovePages — the site builder's own SEO fields were filled in from the start. But that's different from a real audit, real tracking, or any deliberate optimization strategy. The foundation existed; the actual work hadn't started.
I used a tool, my site's SEO and AI-discoverability, and hands me a task list to work through.
The first audit came back rough: 9 pending tasks, a "No" on Content Match, an SERP Score of 35, Page Speed at 57.
I didn't try to fix everything at once. One task at a time, in order, so I wouldn't overwhelm myself with a wall of red flags.
What Actually Got Fixed
Over two sessions, I worked through the list:
- Rewrote all four service descriptions using problem-first language, so the copy matched how someone actually searches, not how I'd describe my own business to myself.
- Rebuilt my Google Business Profile — updated the category, rewrote the description around my actual framework, trimmed the services list down to my three real offers, linked LinkedIn.
- Fixed six technical SEO items in one pass — robots meta tag, canonical link, language attribute — all through a single code block in GroovePages' site-wide head settings (a lesson in itself: GroovePages has separate head-code sections for site-wide vs. individual pages, and it's easy to paste something in the wrong one and wonder why nothing changed).
- Added alt text to every key image, including five images tied to the CONNECT Framework pillars.
- Confirmed my H1 tag was actually correct — small thing, but worth checking, not assuming.
Nine tasks became zero. Then two more appeared on a follow-up check (a naming mismatch on my Business Profile, a page title that needed sharper copy) — both resolved. Twelve completed tasks total.
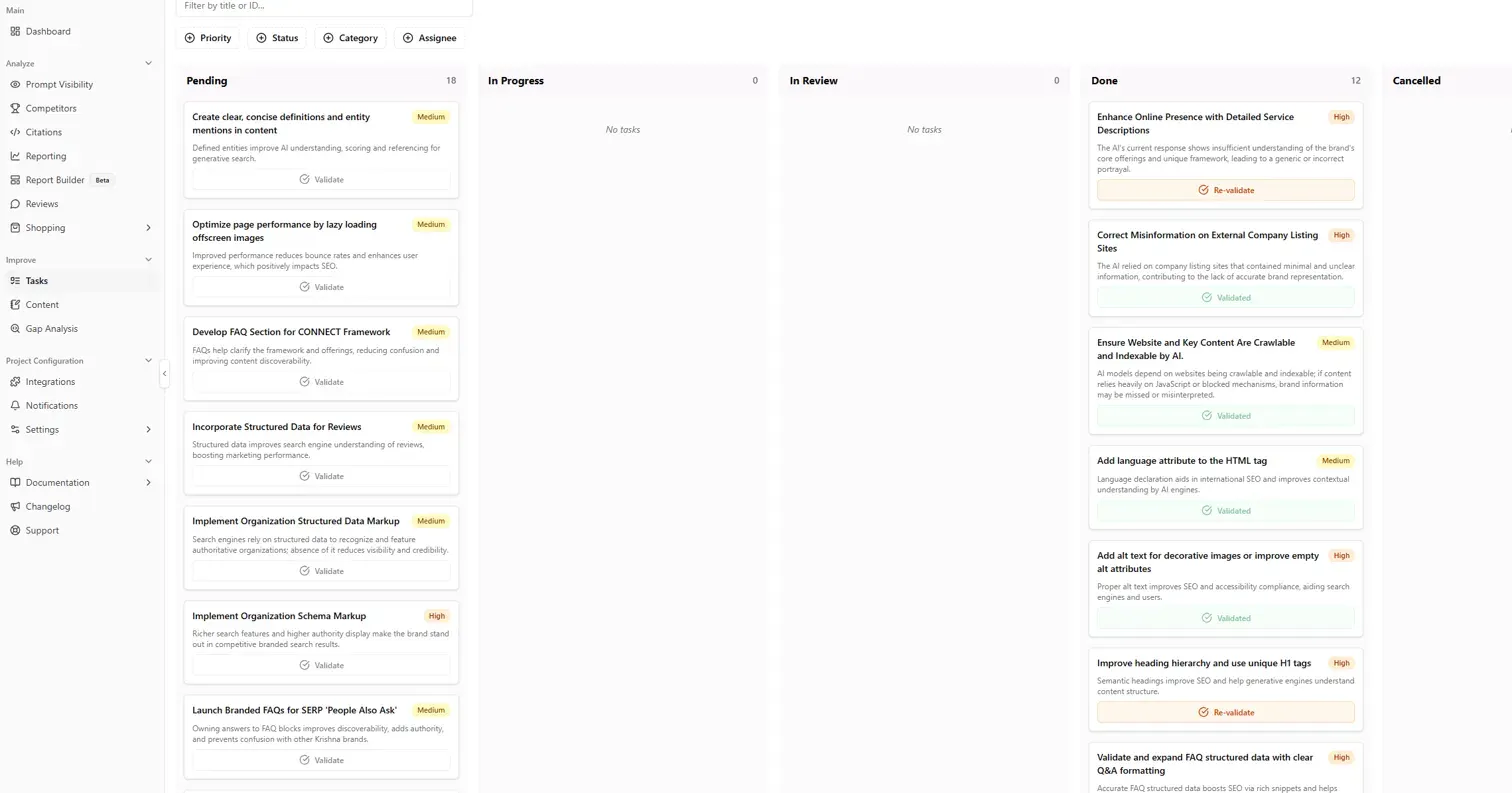
Since then, a fresh batch of tasks has already shown up — eighteen new pending items, mostly around structured data, schema markup, and content depth. At first that felt discouraging, like I hadn't actually finished anything. But that's the wrong way to read it. Visby keeps re-evaluating the site as standards and AI-discoverability checks evolve — "done" was never going to be a permanent state. SEO isn't a list you clear once. It's a list that keeps refreshing as the bar moves.
Picking One Task and Going Deeper Than the Checklist
I picked one of those eighteen — "Implement Organization Schema Markup" — and instead of treating it as a box to check, I actually went and verified it properly using Google's own tools. That decision turned into the most technically real debugging I did this whole six weeks.
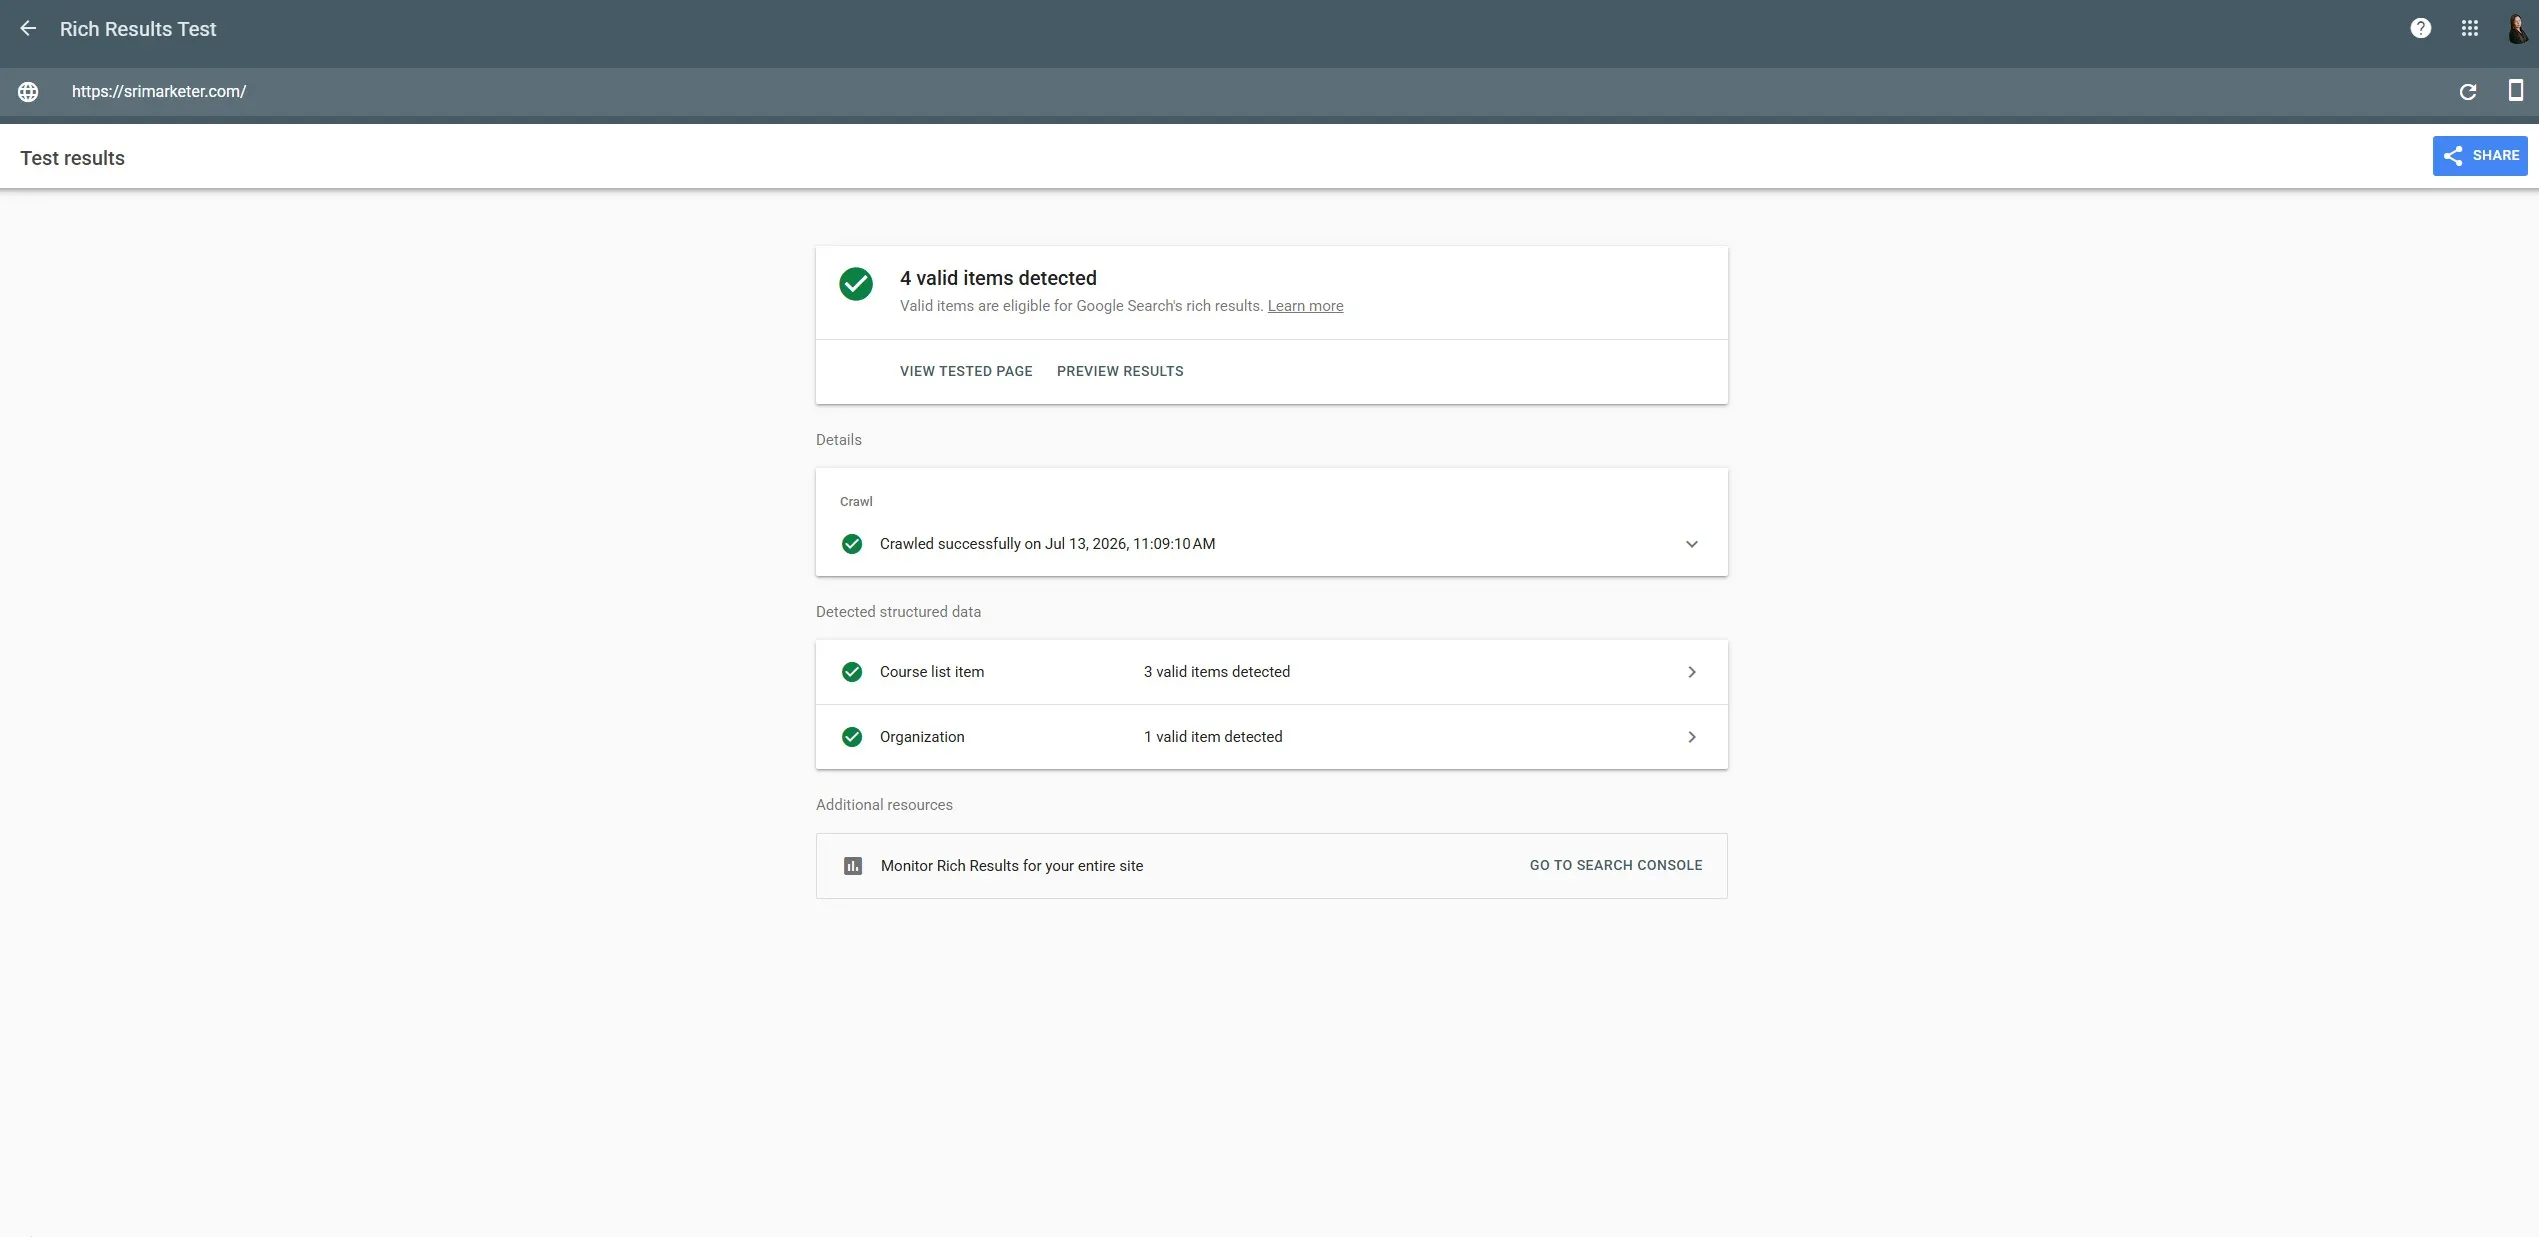
I built the schema, added it to my site, and ran it through Google's Rich Results Test and schema.org's validator to confirm it worked.
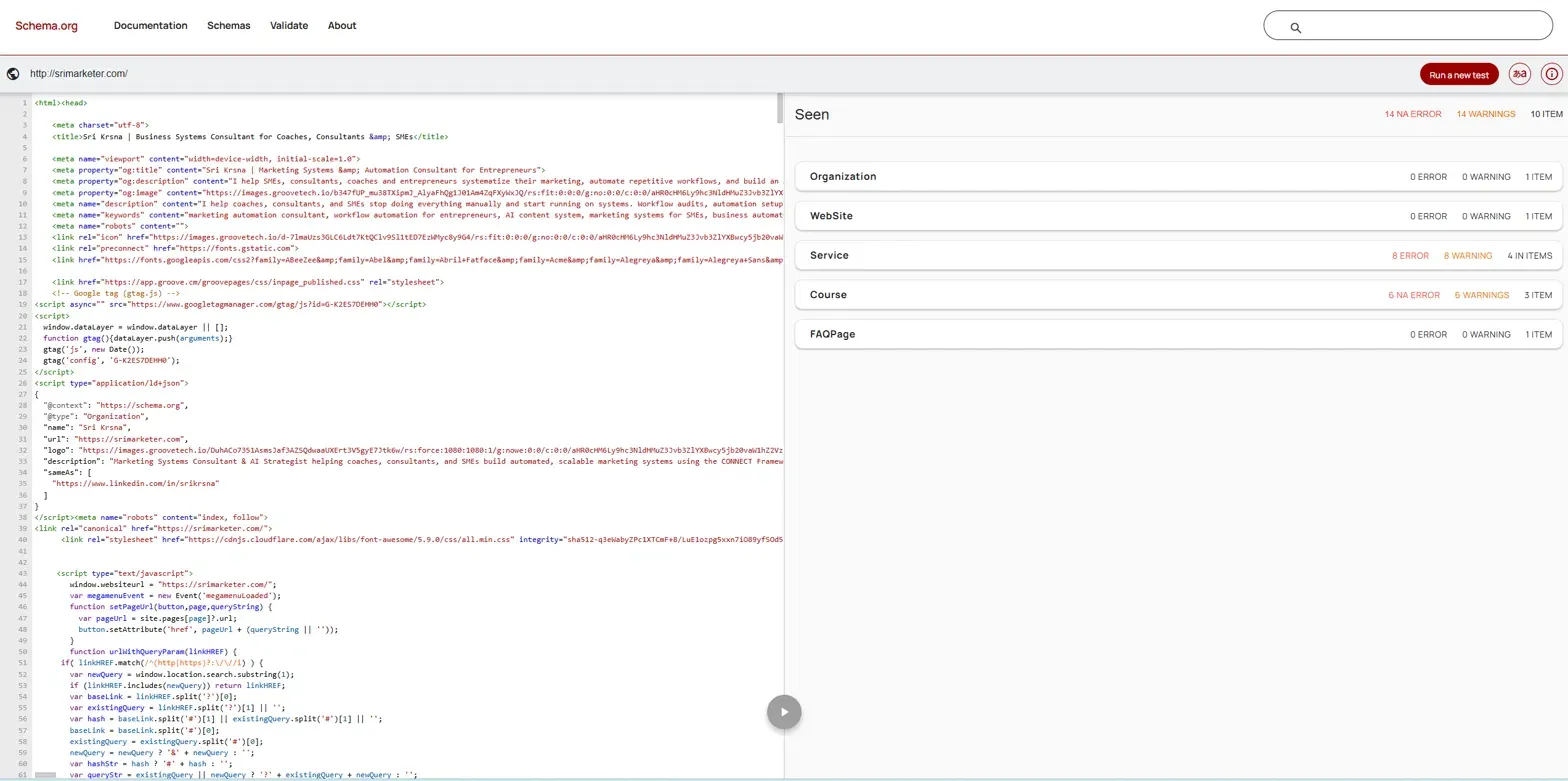
The Organization markup itself was clean. But the validator surfaced something I didn't expect: my site's Service and Course schema — code I didn't even know was live, sitting somewhere I hadn't touched — had real errors. Eight errors and eight warnings on Service alone.
I went hunting for where that code actually lived. Not in the page's visible content. Not in GroovePages' site-wide tracking codes. Not in the page-specific tracking codes either. Three dead ends, each one still useful — each "not here" narrowed the search.
It turned out to be sitting inside a custom embed block in the site footer — a separate, mostly invisible component I'd never have thought to check if I hadn't ruled out everything else first.
Inside it: a schema type called "ConsultingService" — which sounds like a perfectly reasonable thing to call a consulting business. Except it isn't a real schema.org type. It doesn't exist in their spec. Google's validator was treating the entire block as invalid because of one made-up label.
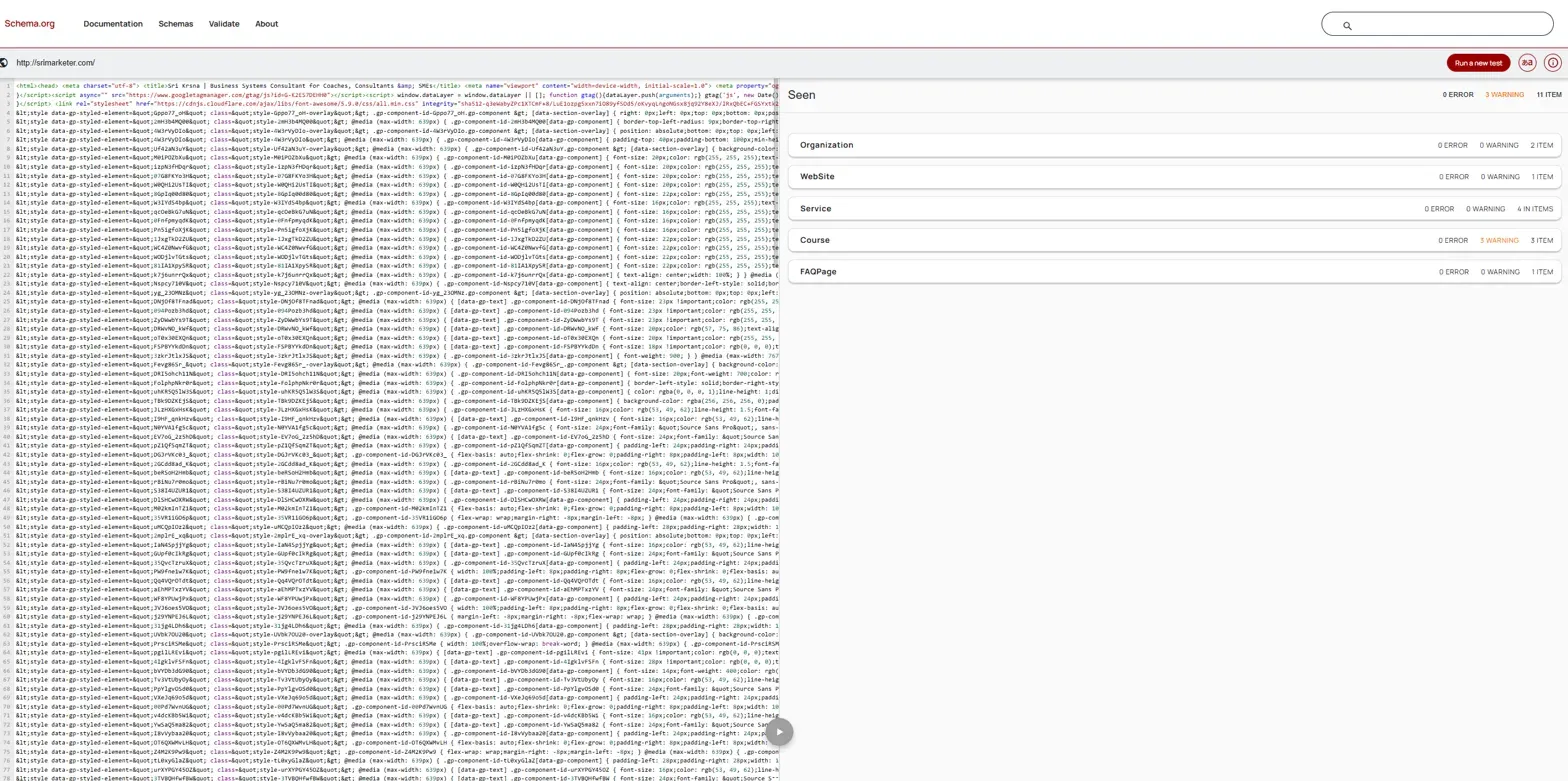
I changed it to "Organization" — a real, recognized type — and cleared the actual errors. But fixing that surfaced a second, quieter issue: once Google could actually parse the entity properly, it flagged that a few properties (serviceType, priceRange, availableChannel) had been sitting on the Organization itself, when they only belong on the individual services underneath it. Not wrong data — just filed in the wrong place. I moved on, trimmed the duplicated fields, and the warnings cleared too.
Almost Broke Something Real Along the Way
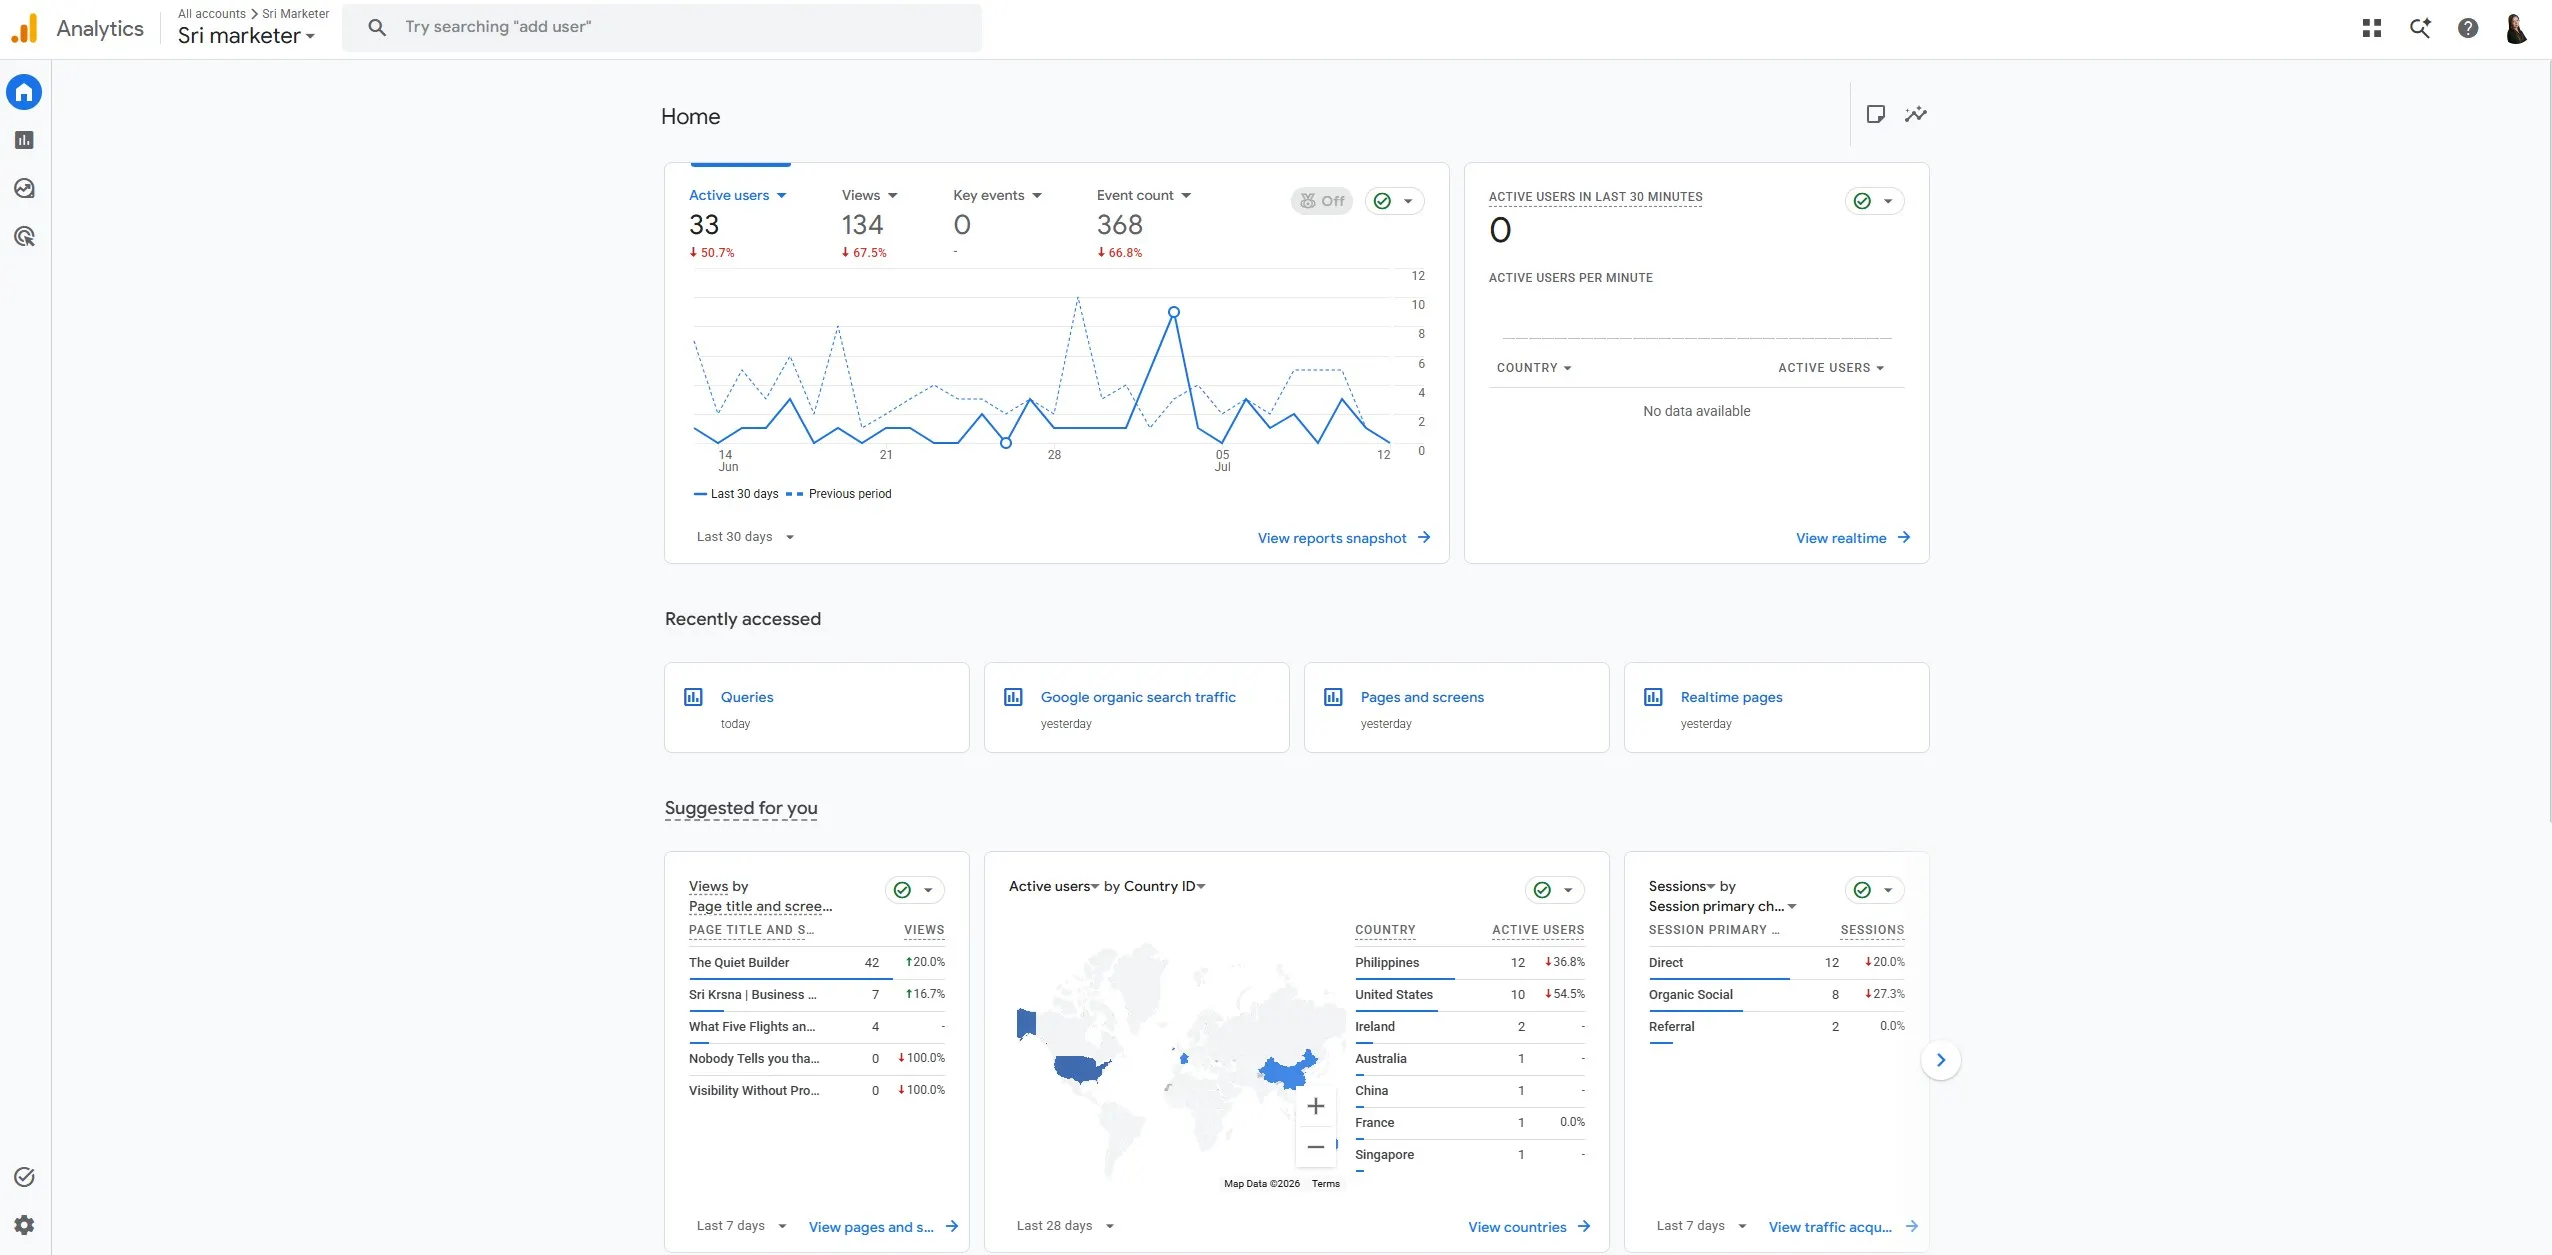
While I was hunting through GroovePages' tracking code sections looking for that schema, I found something else: my site's GA4 tracking script was missing. Not broken — genuinely gone, down to three lines of leftover meta tags. I don't know exactly when it happened, but it meant analytics may not have been recording for some unknown stretch of time.
I rebuilt the full tracking block — GA4 script, canonical tag, robots meta, language attribute — and confirmed it was live again by checking GA4's Realtime report while browsing my own site in another tab. Five active users, real events firing, my own visit showing up on the map.
That one scared me a little, honestly. It's a good reminder that "SEO work" isn't just adding things — it's also making sure you don't accidentally break something that was already working, and building the habit of verifying instead of assuming.
Then a Canonical Conflict Showed Up
Partway through, Google Search Console flagged something I hadn't anticipated: a conflict between the http and https versions of my site. Google had indexed one version as canonical, but my site was pointing to the other.
I didn't force a redirect — that felt like the wrong move for a homepage, too easy to break something bigger than the problem itself. Instead, I temporarily aligned my canonical tag to whichever version Google had already selected, requested reindexing, then reverted back to https once Google confirmed it as the valid, indexed version.
It resolved itself. But it taught me something I didn't expect going into this: sometimes the right move in SEO isn't to fight the system, it's to briefly agree with it, then correct course once it catches up.
The Tool That Lied to Me (Sort Of)
Here's the part I actually want to talk about, because it's the part nobody warned me about.
I also checked my site on another tool, a separate SEO scoring tool. It gave me a 58 out of 100.
While the other, around the same time, was showing 88.
Two tools. Same website. A 30-point gap.
My first instinct was to panic slightly — which number was real? But instead of picking whichever one felt worse (or better) and running with it, I dug into why they disagreed. Turned out the other tool's crawler was being blocked by Cloudflare — it literally couldn't access my site properly to score it. The 58 wasn't a real reflection of anything. It was a tooling problem, not an SEO problem.
That was the moment I stopped trusting any single dashboard number at face value. A score is only as good as the crawler's ability to actually see your site.
Turning to the Source of Truth
After that, I leaned more on Google Search Console and GA4 directly — not because third-party tools are useless, but because when there's a discrepancy, Google's own tools are the ones actually deciding my fate in search results. Everything else is an estimate, these are the real numbers.
And the real numbers, when I actually looked, were humbling.
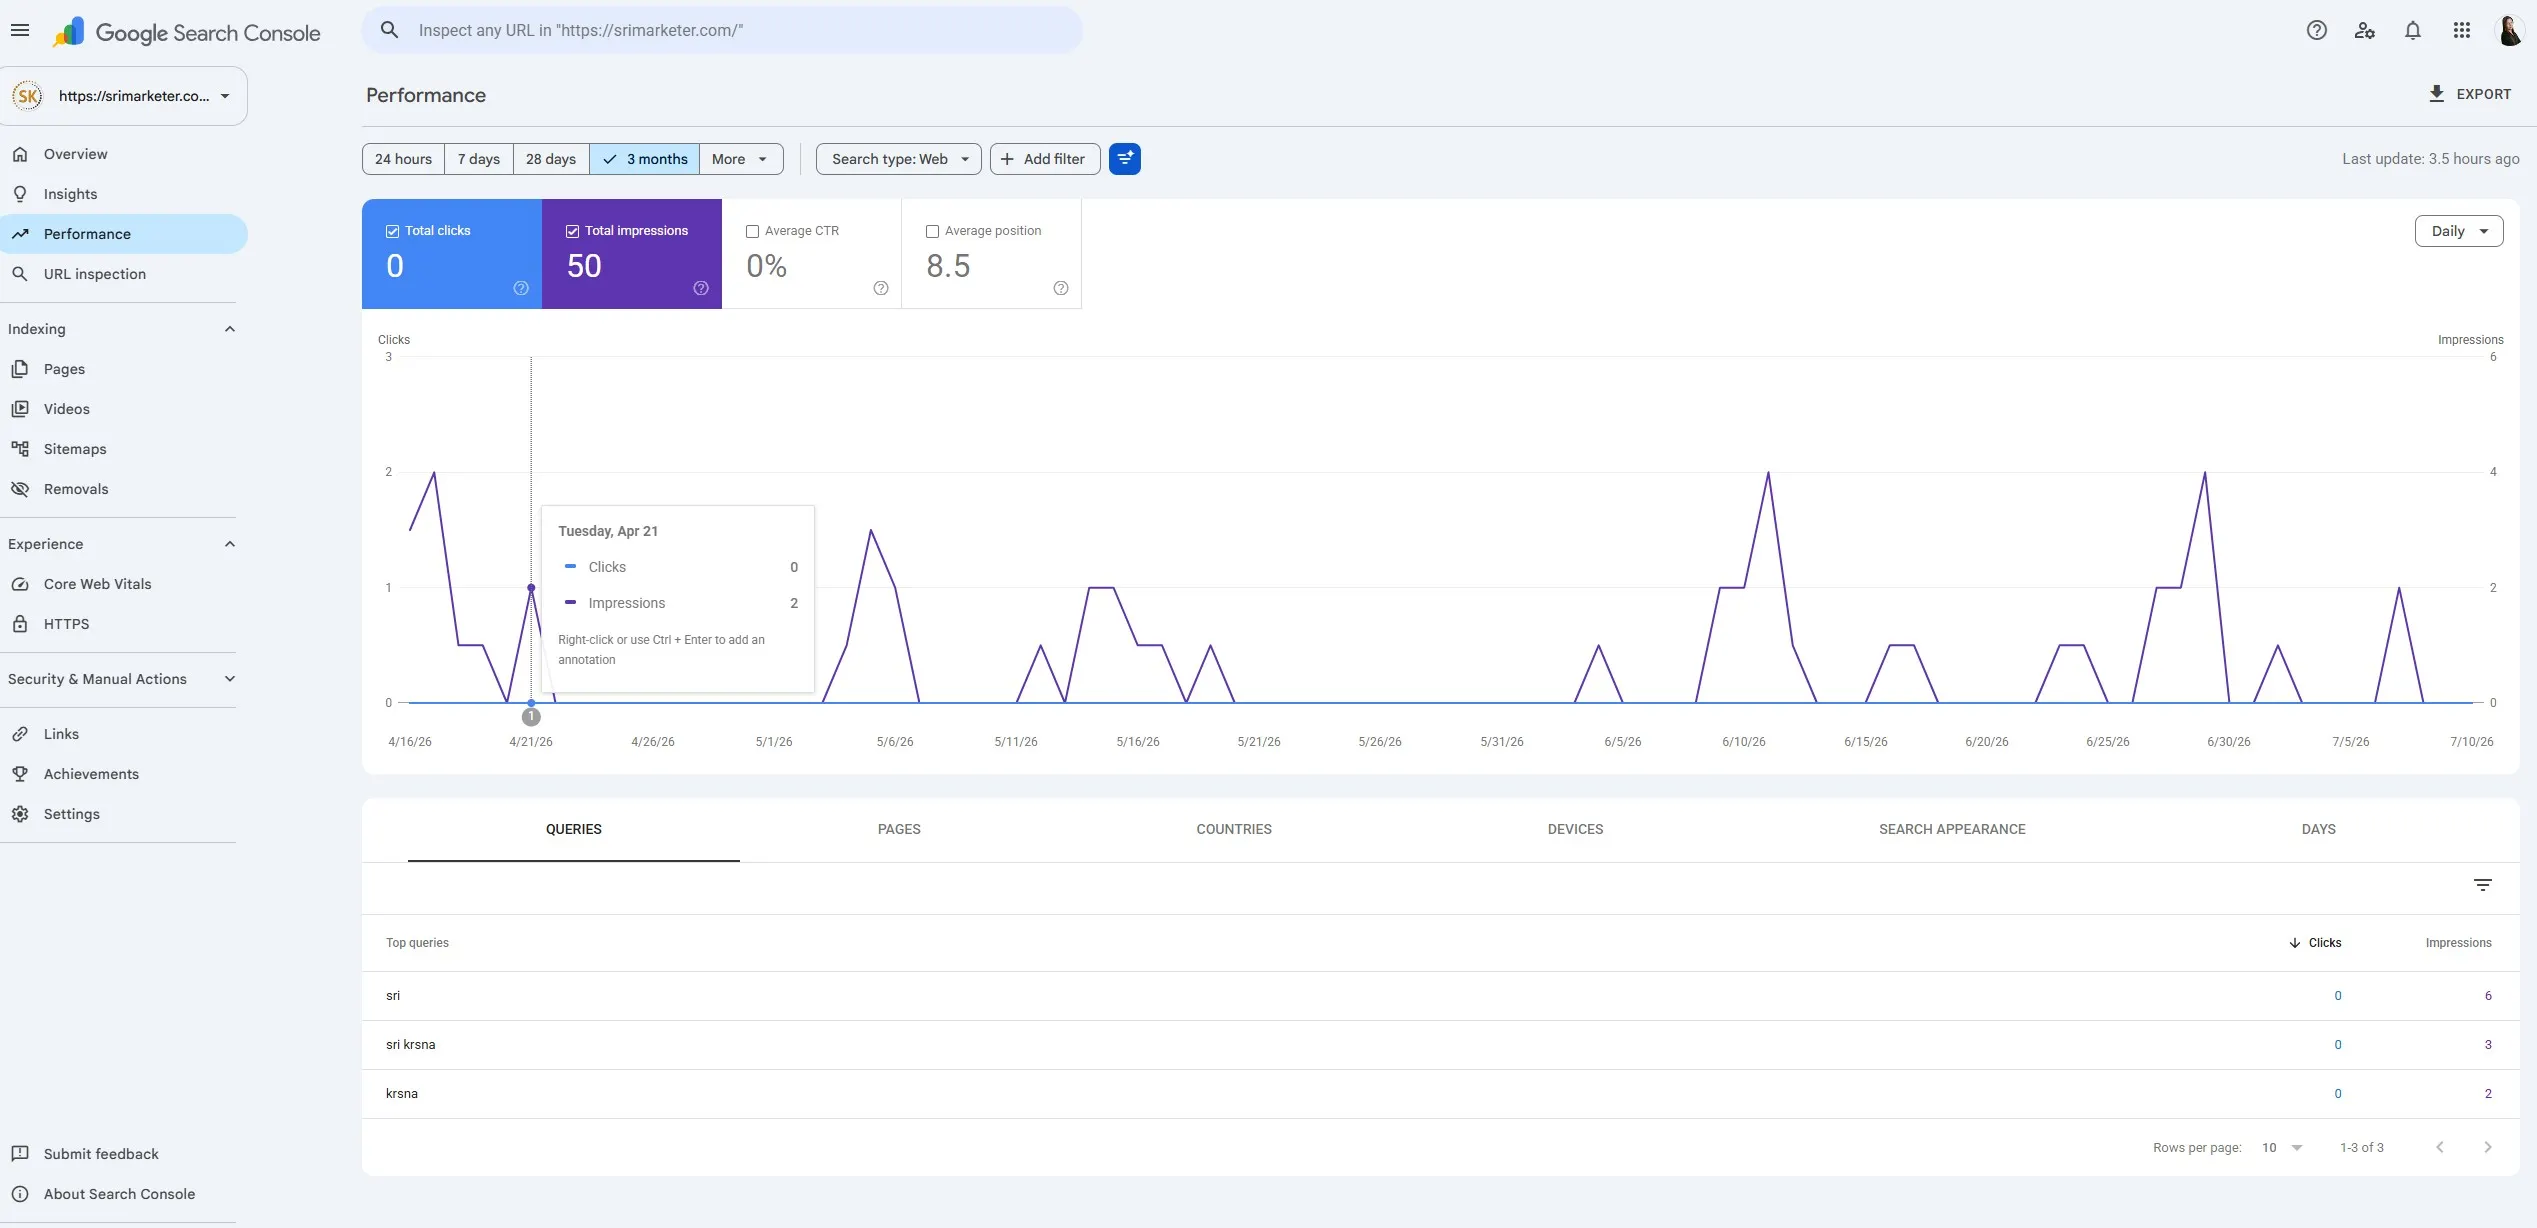
Over a 3-month window: 0 clicks. 50 impressions. Average position 8.5.
Position 8.5 is closer to the bottom of page one than I expected, actually — but zero clicks on 50 impressions still tells a clear story. Showing up isn't the same as being chosen. I went a layer deeper and checked which search queries were actually triggering those impressions.
Three queries showed up by name: "sri," "sri krsna," and "krsna."
All three branded. People who already knew my name, typing it in. Not a single non-branded, problem-language search — nobody searching "workflow automation consultant" or anything close to what I actually do, finding me organically yet.
That's not a failure. It's just an honest, unfiltered snapshot of week six.
Other Challenges Along the Way
A few smaller, quieter problems, worth naming because they're the kind that don't show up in a "how to do SEO" article:
GrooveBlog doesn't auto-generate a sitemap. Which meant Google had no automatic map of my blog posts to discover them quickly. The workaround: manually requesting indexing per post through Search Console's URL Inspection tool. Slower, more manual, but functional.
A duplicate canonical flag on my membership site's homepage. Same instinct as before — I let Google re-crawl and resolve it rather than forcing a fix that might create a bigger problem.
Page speed stuck at 57, likely a platform limitation (GroovePages doesn't give me control over things like lazy-loading offscreen images) rather than something I was doing wrong. Worth knowing the difference between "a problem I can fix" and "a platform ceiling I'm working within."
Why None of This Actually Worries Me
Here's the thing I keep coming back to, and the actual point of this post: SEO takes time because trust takes time.
Google doesn't just check whether a page is technically correct. It watches how a domain behaves over months — whether other sites link to it, whether content keeps showing up consistently, whether people who land on it actually stay. None of that can be rushed, and none of it happens on week six of a brand-new blog, no matter how clean the technical setup is.
Six weeks in, with 88/100 on the technical side and branded-only visibility, I'm not behind. I'm on schedule for exactly where a new domain should be.
What's Actually Next
Not backlinks. Not yet.
The real next move, based on everything above, is distribution — and it's sitting right in front of me. I have 8,700+ LinkedIn connections and a newsletter with 1,000+ subscribers, and right now, people only find my blog by accident — clicking through my homepage nav menu. I haven't actually been sharing individual posts on LinkedIn at all.
So the next 30 days look like this: optimize the strongest existing posts for real keywords, actually share them on LinkedIn with real hooks (not just "new post, link below"), and let the newsletter reinforce it. Backlink building comes after — once there's a stronger body of optimized content actually worth linking to.
I Compressed My Images and My Site Was Still Slow — Here's What Was Actually Wrong
For weeks, one number on my Visby dashboard refused to move: Page Speed, sitting at 57. Yellow. Not broken, not great. Every other score on the site had climbed — SEO, GEO, Organization schema, all green — but page speed just sat there.
I assumed I knew why. I assumed it was images. It's almost always images.
I was wrong, and figuring out why turned into one of the more useful debugging sessions I've had building this site.
Where I Started Looking
My first instinct was to go after the obvious suspect — images. I compressed the hero banners, the service card graphics, the blog thumbnails. Standard advice, and not bad advice on its own.
The score barely moved.
That's usually the moment people either give up or start guessing at something else to compress. Instead, I decided to actually measure what was happening rather than keep guessing.
I opened Chrome DevTools, went to the Network tab, did a clean hard refresh, and let the page fully load without touching anything.
The numbers that came back were rough: 123 requests, 22.6 MB of resources, a 7.41 second load time. For a marketing homepage, that's heavy — a well-optimized page usually sits well under 3 MB.
The Real Culprit Wasn't What I Expected
Sorted by file size, the images weren't actually the biggest offenders. Buried in the request list were several .mp4 files, along with a script called videojs-overlay.js and a small icon file named ClickForSound.
I hadn't thought about it until I saw it laid out — my homepage had an autoplaying video background. And autoplaying video, by browser rules, has to be muted to play automatically at all. That's exactly why the "ClickForSound" unmute icon existed — it wasn't a stray widget I'd forgotten about, it was the standard, expected companion to any muted autoplay video.
None of that showed up when I just looked at the page. It only showed up when I actually measured what the browser was downloading.
The Fix Was Simpler Than the Diagnosis
Once I knew what was actually driving the weight, the fix was straightforward: I removed the video background and replaced it with a static image.
I re-ran the same clean test afterward. The difference was immediate:
- Requests: 123 → 73
- Transferred: 10.5 MB → 5.7 MB
- Resources: 22.6 MB → 9.8 MB
- Load time: 7.5s → 3.02s
More than half the payload, gone, from one change — and the page still looks clean.
One More Thing I Found Along the Way
While I was in there, I noticed something that would've been easy to miss: a CSS file — chunk-vendors.css, 381 KB — was loading twice on the same page. Same file, requested twice, for no visible reason. I haven't fully resolved that one yet (it looks like a platform-level quirk, not something in my content), but I wouldn't have caught it if I hadn't gone looking at the raw network data in the first place.
That's really the whole lesson here: dashboards tell you that something's wrong. They don't always tell you what. For that, you have to actually look.
Why This Isn't Just a Vanity Metric
Page speed isn't just a "nice to have" number for its own sake — Google has used Core Web Vitals as a real, confirmed ranking factor since 2021, and slow-loading pages tend to have higher bounce rates, especially on mobile. A visitor who leaves before the page finishes loading never gets a chance to read anything else you've done right.
So the schema fixes, the meta description work, the branded-search cleanup — none of it matters as much if the page itself is too slow for someone to stick around and see it.
This is genuinely the kind of diagnostic work I now walk clients through directly in a Workflow Audit — not guessing at what's slow, but actually measuring it, finding the real cause, and fixing the thing that's actually costing you, not just the thing that looks like it might be.
"Google itself confirms that Core Web Vitals and page experience genuinely factor into how pages rank — so this isn't just a vanity metric I'm chasing for its own sake."
What's Next
This was one of three things I found and fixed in the same week. The next one is stranger — I found an old, forgotten website of mine quietly competing with my current brand in Google's search results. That one's coming next.
This is part of what I'm building in public through The Quiet Builder — the honest version, not the highlight reel. Anyone working through their own SEO from scratch deserves the real dashboard numbers, not a polished case study.
CONNECT pillar: Clarify (auditing before acting) and Optimize (fixing what already exists)
Popular Posts






















Sri Krsna Sagun
Marketing Systems Consultant & AI Strategist helping coaches, consultants & SMEs build AI-powered business systems.
Book a Free Call →